So, your drawing is ready?
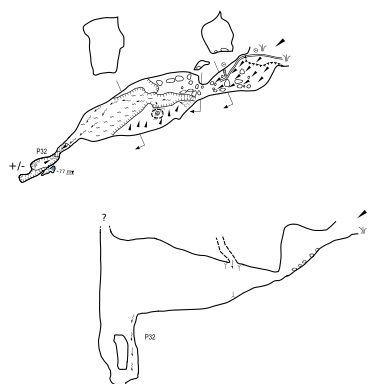
Now that we have our map ready, it is time to lay it out for a nice PDF export.
Obviously, before preparing a legend, it would be nice to have a grid and a scalebar.
Grid options
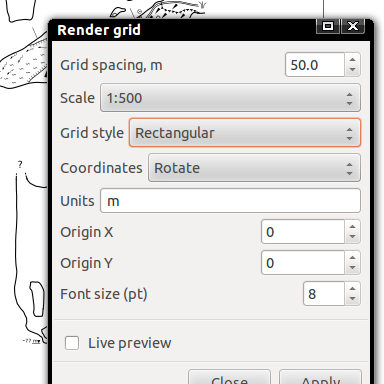
Lets' go to Extensions / Speleo / Generate / Render grid....
You need to tell the extension the scale of your drawing and decide whether you want the coordinates printed where the grid lines end or not. The X-axis coordinates can be rotated 90 degrees.
There are actually two styles of grid available - one is a traditional, rectangular grid. The other one (Crosses) is a minimalistic grid, without lines, but rather just small crosses printed out at grid intersections.
Click Apply.
Getting it right
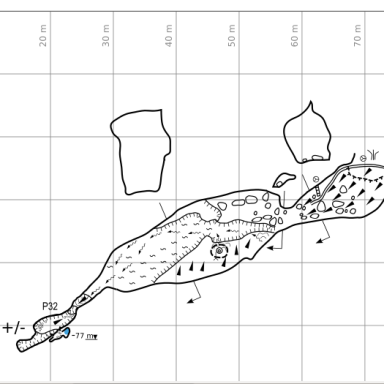
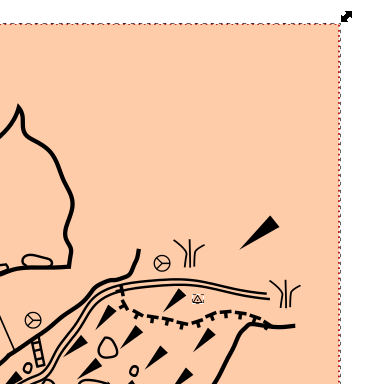
By default, the grid covers the whole page and coordinates start at top left corner of the page. This is most often not what we need.
Lets' adjust the grid origin point first. Delete the grid. Open Object / Symbols and select the Cave plan symbol set. Drag a station symbol onto your drawing and place it where (0, 0) should actually be.
Better origin
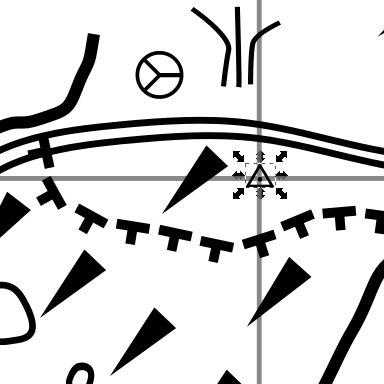
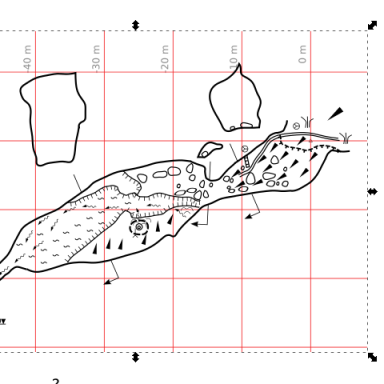
Make sure the symbol is selected (dashed lines and transformation handles around). Run Extensions / Speleo / Generate / Render grid... again. Adjust Origin X and Origin Y if it is not really (0, 0) that should be where the station symbol is. Click Apply.
It is almost good, but in our example we actually do not want the grid to fill all the page. As a matter of fact, we need two grids - one for the plan and other for the elevation drawing.
Confine the grid
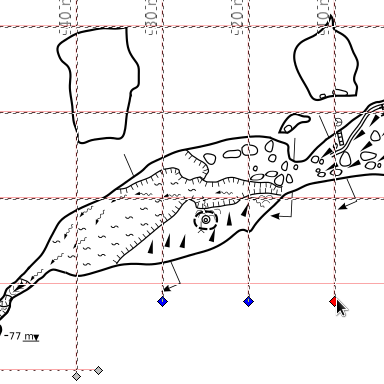
Delete the grid again. Now draw a rectangle defining an area where the grid should appear. Select both that rectangle and the station symbol that we used to indicate the origin point.
Re-run the grid extension (you can simply use Extensions / Previous extension or Alt+Q).
Almost good
Now it is much better, but perhaps you would rather have the lines in red? Simply select the grid object and go to Fill and Stroke. You can adjust line color in the Stroke paint tab and coordinate text color in Fill.
Making it perfect
The grid is a simple group, containing groups of lines and text inside. You can ungroup it by hitting Ctrl+U twice and re-work it.
For example, you may want to select all the grid elements, use the Node tool to select a couple of line ends and then drag them together with Ctrl held so that they are shorter.
Another trick is to select one of the coordinate captions, right-click it and choose Select same / Object type. After that, going to Text / Text and font... will let you adjust font size and font face for the coordinates.
Adding a scalebar
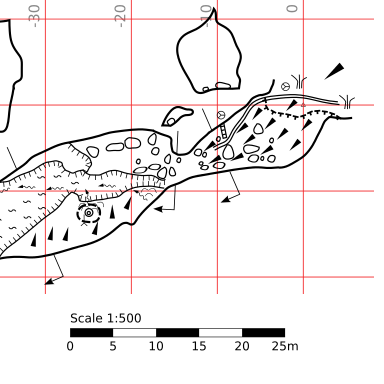
Generating scalebars is even easier. Simply go to Extensions / Speleo / Generate / Render scalebar.... Again, you need to tell Caveink what scale are you drawing in.
Again, you can go to Object / Fill and stroke to adjust colors of your scalebar.